Does Grade Point Average Matter for Matriculation into Postsecondary Education?
Tabu Winslow Morris, MBA
From the Upward Bound Catonsville Program, Community College of Baltimore County, Baltimore, Maryland.
Tabu Winslow Morris, MBA
800 South Rolling Road, Baltimore, MD 21228
(443)840-4486
tmorris2@ccbcmd.edu
ABSTRACT
Does a student’s high school grade point average (HSGPA) of 2.5 or greater determine or predict a successful post-secondary enrollment? For this research, historical data from the 2015-2021 cohorts of Upward Bound Catonsville (UBC) scholars were retrieved from the UBC Community College of Baltimore County (CCBC) Blumen Database report. To ensure our scholars maintain a 2.5 or better HSGPA, UBC uses several methodologies to monitor and intervene if necessary to ensure that the benchmark is being upheld including monthly check-ins with assigned program coordinators, Tutor.com, and virtual tutoring with faculty. An all-hands-on-deck approach is put into play if a student slips below a 2.5 HSGPA; they are then assigned to meet with the program director until their HSGPA exceeds 2.5 HSGPA. These approaches are a combined methodology that somewhat mimics the graded response model (GRM) and hybrid data analytics (HDA). The qualitative and quantitative data show that HSGPA matters for UBC scholars with successful enrollment into post-secondary education. It is not the only thing universities or colleges use; however, it levels the playing field. The research shows that a 2.5 or higher HSGPA is recommended to enroll in post-secondary education and speaks to many characteristics of an individual’s work ethic. When comparing CCBC average HSGPA of all freshmen students and all transfer students who enter the fall semesters, the UBC graduates’ HSGPA is around 0.50 basis points higher. Post-secondary attainment helps lower unemployment ratios, improve quality of life, and reduce systemic poverty. If we want to solve some of America’s labor ills, the findings support and suggest starting with getting a student’s HSGPA to 2.5 or greater.
INTRODUCTION
CCBC’s UBC Program is a Department of Education (DOE) grant awarded through a competitive request for proposal process every 5 years. There are several benchmarks that the UBC grant is required to meet: 1) Funded to serve ratio; 2) Eligibility criteria; 3) Academic performance-grade point average; 4) Academic performance on a standardized test; 5) Secondary school retention and graduation; 6) Secondary school graduation (rigorous secondary school program of study); 7) Post-secondary enrollment; and 8) Post-secondary completion.
Benchmark 3 requires that 74% of participants served during the project year have a cumulative HSGPA of 2.5 or better on a 4-point scale at the end of the school year. Why is that HSGPA requirement essential? Most universities or colleges require a minimum HSGPA to be considered for admittance. Since UBC is a college preparation and readiness grant for high school students, without tracking our scholars’ HSGPAs, the program would not be able to determine college readiness. Benchmark 5 provides UBC the statistics on how many of our scholars graduated with their high school diplomas and matriculated onto post-secondary education, which is benchmark 7. The data collected will determine if an HSGPA of 2.5 or greater determines or predicts a successful post-secondary enrollment.
The approved UBC objectives for the DOE grant cycle from 2017-2022 are presented below. The 5 objectives are tracked throughout the grant life cycle for attainment. This is the measurement that UBC must reach. Each year an annual progress report (APR) is completed by the program director on or about December 15 for the DOE to establish if the benchmarks have been attained. The overall goal of the UBC is to see our scholars matriculate from secondary education and complete post-secondary education within 6 years of completing the UBC program.
| Objective 1. Academic performance GPA: 74% of participants served?during the project will have a cumulative GPA of 2.5 based on a 4-point scale at the end of the school year.? |
| Objective 2: Academic Performance on Standardized Tests: 80% of UBC seniors served?during the project year will have achieved at the proficient level on state assessments in reading/language arts and math. |
| Objective 3: Secondary School Retention and Graduation: 95% of project participants will continue to participate in school for the next academic year at the next grade level, or will have graduated from secondary school with a regular secondary school?diploma. |
| Objective 4: Secondary School Retention and Graduation: Rigorous Secondary Program of?Study: 80% of all current and prior year UBC participants who graduated from high school during the school year with a regular secondary diploma will complete a rigorous?secondary school program of study.? |
| Objective 5: Post-Secondary Enrollment: 80% of all current and prior UBC?participants, at the time of entrance into the project, had an expected high school graduation date during the school year will enroll in a program of post-secondary education by the fall term?immediately following high school graduation, or will have received notification by the fall term?immediately following high school from an institution of higher education of acceptance but?deferred enrollment until the next academic semester (e.g., spring semester).? |
| Objective 6: Post-Secondary Completion: 50% of all participants who enrolled in a program of?post-secondary education by the fall term immediately following high school graduation or by the next academic term (e.g., spring term) as a result of acceptance but deferred enrollment, will attain?either an associate?s or bachelor?s degree within 6 years following graduation from high school.? |
METHODS
Each semester we collect student HSGPAs by obtaining a copy of the student’s report card and the final transcript. Once a year, the annual progress report (APR) is completed for the DOE with UBC data entered into Blumen, a database management system. The data collected includes the 8 benchmarks mentioned in the introduction. When the APR is completed, the DOE provides data on previous cohorts from the National Clearing House database for benchmarks 7 and 8.
UBC uses several methodologies to monitor and intervene if necessary to ensure that the benchmark is being upheld including monthly check-ins with their assigned program coordinator (Table 5), Tutor.com (Table 4), and virtual tutoring with faculty (Table 1). Table 5 reflects a comprehensive approach which includes the program director meeting weekly with each student whose HSGPA is below 2.5. The findings analyze the UBC 9th through 12th-grade cohorts from 2016-2021. “The qualitative data provides the summative assessments while formative assessments result in quantitative data. Quantitative data has statistical value because it is measured in numbers while qualitative data is the type of data that describes information using groups and categories” (Formplus Blog, 2022). Both quantitative and formative data are used for this project.
Two different methodologies show similar results that support UBC’s approach to assisting students with maintaining an HSGPA of 2.5 and above. Our scholars will be viewed in a favorable light when they see UBC as an organization listed on their college application; they can assume that this student is college ready. The first methodology is noted by Allen and Mattern (2019), who used the GRM. They examined summary indices of high school performance, including coursework, grades, and test scores based on the GRM. Universities that consider multiple factors in admission decisions, including high school coursework along with HSGPA and test scores, will have a more accurate picture of their applicants’ level of college readiness and success.
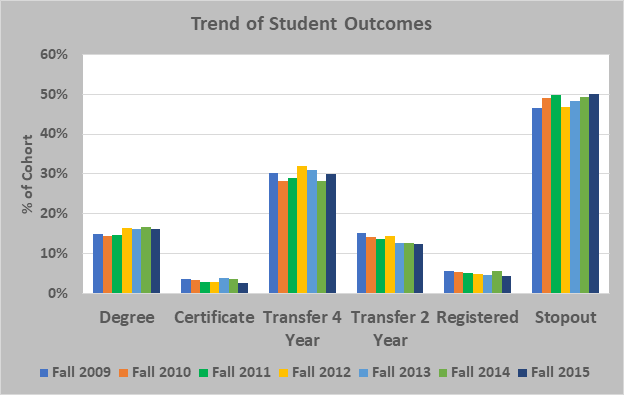
Figure 1 gives us a raw picture of the 6-year outcomes of CCBC freshmen and transfer students with their matriculation. Note that students who earn an award and transfer are counted in both categories. When you compare CCBC’s students with the outcomes and HSGPA, one can conclude that the higher the students’ HSGPA, the better their success ratio of completion. For example, in cohort classes 2013 and 2014, the HSGP was below 2.5. Their completion ratio for C/O 2013, was 6,699 enrolled and 2,125 completed. In the C/O 2014, 6,192 enrolled and 2,109 completed. However, in C/O 2015 with an average HSGPA above 2.5, the cohort completion ratio was higher; 5,889 enrolled and 3,847 completed. More research can be conducted to confirm this hypothesis. Still, the raw data shows a glimpse of success, with students who enter a 2-year or 4-year higher educational institution more likely to succeed.
The second methodology is by Al Hazaa et al., (2021). Their methodology suggests that there is a significant relationship between HSGPA with post-secondary education attainment and early years’ salary. Most empirical studies’ findings evidence of the power of HSGPA in measuring student readiness for college and positive findings on academic performance. They also correlate HSGPA to securing post-secondary education and post-secondary graduation. The methodology approach used was HDA which predicted graduation rates depending on high school performance. The research proves that HSGPA does matter, and Table 8 supports this methodology.
Quantitative data are shown in Tables 1-4. In tables 1, 2, and 4, UBC uses a similar approach to the GRM methodology. Tables 1 and 4 use GRM concerning the scholars’ contacts in the subject matter classes with the virtual faculty tutoring and Tutor.com. When comparing virtual tutoring with faculty versus Tutor.com, one of our C/O 2022 graduates, Victory A., summed it up by stating that being on camera face-to-face with our faculty helps us to be able to understand the concept of our topic better and one con is the limited meeting time and availability. Adding the virtual piece by a faculty gave a personal touch to the students with a familiar individual assisting consistently. It tied the coursework and tutoring as a seamless approach. Table 2 is a mixture of both methodologies showing the results of the HSGPA, standardized test scores, and post-secondary enrollment. Table 3 is an example of the HDA method.
Qualitative (formative) data is shown in all figures by providing a visual methodology with the infographic, which shows the wrap-around services UBC offers to ensure our scholars achieve an HSGPA higher than 2.5. These wrap-around services are also provided as quantitative data in tables 2, 4-5. With every touch of a faculty or staff member with a student, the chances of that student achieving the desired outcome are higher. The wrap-around services add support.
Photovoice methodology is a qualitative approach that uses photos to reflect upon emotions and experiences. The qualitative and quantitative data help to portray how the methodologies used are comprehensive, detailed, and complex, just as getting a ninth grader through to enrolling into post-secondary enrollment with a higher than a 2.5 HSGPA. The HDA of HSGPA in measuring student readiness for college and positive findings to academic performance is shown in the wrap-around services that build good habits during post-secondary education. GRM method proves the combination of classwork, standardized test, and HSGPA assist with post-secondary enrollment.
RESULTS
During the COVID-19 pandemic, the program took our in-person tutoring virtual. Before COVID-19, the program did not understand the value of virtual learning or a hybrid learning environment. UBC was unsuccessful prior to the pandemic in recruiting and obtaining qualified tutors due to the hourly rates. UBC staff sent notifications to several external organizations to fill tutoring openings without success, so our posting went unfilled. After doing some research, we found that our asking amount was lower than what the market was asking for. CCBC was not competitive in this arena concerning experience and education attainment requirements.
It was simply a no-brainer to convert to a virtual tutoring environment due to the pandemic and utilize our faculty as highly qualified tutors. Table 1 provides the hours clocked from our subject matter faculty for cohort years 2020-2021 and 2021-2022 for English, science, Spanish, math, history, and study skills/college applications. A total of 436 hours were clocked in the subject of math, showing that math is the subject that UBC scholars need the most help with.
| Table 1. UBC Individual Virtual Tutoring Contact Hours with Faculty. | ||
|---|---|---|
| 2020-2021 | 2021-2022 | |
| English | 56 | 67 |
| Science | 20 | 22 |
| Spanish | 5 | 20 |
| Math | 91 | 115 |
| History | 10 | 8 |
| Study skills/college applications | 2 | 20 |
| Total hours | 184 | 252 |
Table 2 shows the number of enrolled students in the program. It reflects UBC’s actual student numbers, not those eligible to participate. Quantitative data are presented for multiple objectives (benchmarks) for the cohorts 2016-2017 to 2020-2021. Data line 2 shows that 4 out of 5 cohorts exceeded the goal of attainment. The 2019-2020 cohort fails to meet this benchmark by 13 basis points.
| Table 2. Percentages of Students Meeting Benchmarks by Year from the Blumen Database. | ||||||
|---|---|---|---|---|---|---|
| Goal | Proposed Objectives 2020-2021 | Proposed Objectives 2019-2020 | Proposed Objectives 2018-2019 | Proposed Objectives 2017-2018 | Proposed Objectives 2016-2017 | |
| Number of actual students enrolled (Goal reflects funded to serve number) | 76% | 61 | 69 | 58 | 63 | 81 |
| Academic performance GPA of 2.5 or better on a 4-point scale at the end of the year | 74% | 75% | 61% | 76% | 78% | 77% |
| Academic performance on standardized tests | 80% | 100% | 100% | 100% | 100% | 100% |
| Secondary school retention and graduation? | 95% | 100% | 100% | 100% | 100% | 100% |
| Post-secondary enrollment | 80% | 100% | 75% | 82% | 93% | 52% |
| Post-secondary education completion | 50% | 11% | 20% | 31% | 50% | 18% |
During the years 2017-2022, there were many organizational changes with UBC. The program director exited CCBC and UBC. A new program director was onboarded in August 2019. In October 2020, UBC became fully staffed with faculty and staff for the first time in 3 years. Data line 5 results show UBC had a 100% rate of secondary school retention and graduation; however, the program failed to meet the goal of post-secondary enrollment in 2 of 5 cohort years. Recruitment efforts suffered as well, with subpar performance in 4 of 5 cohort years. In 2020-2022, COVID-19 hindered recruitment efforts. The highlight of this data shows that with much love from the faculty and staff that remained committed throughout the organizational changes that benchmark 3 (academic performance on standardized tests) and benchmark 4 (secondary school retention and graduation) exceeded expectations.
Table 3 reflects the actual quantitative data of the prior experience scores for reporting periods 2014-2015 and 2013-2014. During these periods the program was partially staffed. Every benchmark exceeded expectations except post-secondary education completion. At this time, tutoring was in-person at the high schools, and nothing was offered virtually. We now know that some students can do well virtually or with a hybrid method. After the summer of 2017, the summer academy no longer had a residential component. The current model for summer academy is a commuter approach. The UBC scholars come to the CCBC campus Monday- Friday from 8:30 AM - 3:30 PM and some days they meet virtually on Google Classrooms. This shows how important the previous model is with the residential component. It allows the wrap-around services that UBC faculty and staff can provide holistically.
| Table 3. Actual Attained Rates for Prior Experience Scores. | ||
|---|---|---|
| 2014-2015 | 2013-2014 | |
| Academic GPA performance | 76% | 75% |
| Academic performance on standardized tests | 100% | 93% |
| Secondary school retention and graduation | 100% | 95% |
| Post-secondary enrollment | 100% | 86% |
| Post-secondary education completion | 67% | 41% |
Table 4 depicts how many hours and sessions the UBC scholars logged utilizing Tutor.com, an online tutoring subsidiary of The Princeton Review. UBC contracted with Tutor.com out of need due to the pandemic for tutoring that could provide 24/7 services. The subjects vary from English and writing to study skills coaching. There were a total of 643 sessions from November 2020 to June 2022. 408 sessions were in the subject math, and 144 sessions were in the subject science. Math and science were the subject matters most utilized.
| Table 4. Hours and Sessions Utilized by UBC Scholars on Tutor.com. | ||||||
|---|---|---|---|---|---|---|
| 11/2020 - 8/2021 | 9/2021 - 6/2022 | 11/2020 - 6/2022 | ||||
| Hours | Sessions | Hours | Sessions | Total hours | Total sessions | |
| All subjects | 152 | 391 | 92 | 252 | 243 | 643 |
| Drop off essay review | 2 | 4 | 2 | 3 | 4 | 7 |
| Reading, writing, & literature | 6 | 16 | 4 | 11 | 10 | 27 |
| Spanish | 4 | 10 | 4 | 9 | 7 | 19 |
| Math- algebra I | 6 | 13 | 4 | 8 | 10 | 21 |
| Math- algebra II | 47 | 55 | 25 | 59 | 72 | 114 |
| Math- calculus | 7 | 59 | 6 | 8 | 13 | 67 |
| Math- geometry | 18 | 72 | 15 | 62 | 32 | 134 |
| Math- pre-calculus | 8 | 23 | 3 | 12 | 11 | 35 |
| Math- statistics | 13 | 20 | 9 | 13 | 22 | 33 |
| Math- trigonometry | 2 | 2 | 2 | 2 | 3 | 4 |
| Science- biology | 9 | 30 | 7 | 25 | 16 | 55 |
| Science- chemistry | 7 | 18 | 3 | 10 | 10 | 28 |
| Science- earth science | 1 | 8 | 1 | 5 | 2 | 13 |
| Science- physics | 16 | 40 | 3 | 8 | 18 | 48 |
| Social studies- civics and government | 1 | 4 | 0 | 0 | 1 | 4 |
| Social studies- US history | 1 | 5 | 1 | 4 | 2 | 9 |
| Social studies- world history | 0.1 | 2 | 0.1 | 2 | 0 | 4 |
| Study skills coaching- studying effectively? | 0.4 | 1 | 0 | 0 | 0 | 1 |
| Writing- essay writing | 2 | 4 | 3 | 9 | 6 | 13 |
Table 5 presents quantitative from 8,264 sessions and 131,603 hours clocked in overall contacts with UBC Scholars from 2019-2022. This data is after the UBC program was fully staffed with faculty and staff and overlaps with the COVID-19 pandemic. Data line 3 is a combination of these services: recreational/educational field trips; career awareness; academic academies; college fair/ prep/ seminar; employment; financial aid assistance and counseling; parent orientation and workshops; and personal counseling.
| Table 5. Contact Sessions and Time Spent with UBC Scholars from 2019-2022. | ||
|---|---|---|
| Sessions | Time (hours) | |
| Academic counseling | 2,222 | 30,053 |
| Program correspondence | 3,519 | 35,707 |
| All other activities | 2,523 | 65,843 |
| Total | 8,264 | 131,603 |
Table 6 reports the average HSGPA calculated from students entering CCBC in the fall term. Entering students would include both new first-time students and students transferring into CCBC.
| Table 6. HSGPA of Students Entering CCBC in the Fall. | ||||
|---|---|---|---|---|
| Total students | Students with HSGPA above 2.5 | Percent of students with HSGPA above 2.5 | Average HSGPA | |
| Fall 2013 | 7,090 | 26 | 0% | 2.46 |
| Fall 2014 | 6,357 | 31 | 0% | 2.30 |
| Fall 2015 | 6,137 | 255 | 4% | 2.56 |
| Fall 2016 | 5,959 | 640 | 11% | 2.62 |
| Fall 2017 | 5,289 | 1,492 | 28% | 2.72 |
| Fall 2018 | 5,039 | 1,810 | 36% | 2.66 |
| Fall 2019 | 4,970 | 2,255 | 45% | 2.66 |
| Fall 2020 | 4,781 | 2,497 | 52% | 2.72 |
Figure 1 shows student completion rates 6 years after entering CCBC. It includes both new first-time students and transfer students. Note that students who earn an award and transfer are counted in both categories.
DISCUSSION AND CONCLUSION
The quantitative data and the formative assessments suggest that HSGPA does matter in the matriculation of UBC scholars from completing their secondary education and enrollment into a post-secondary institution. Quantitative data in Table 2 from cohort years 2016-2021 shows 2 years that the benchmark for post-secondary enrollment was not met. Within that same timeframe, the benchmark for the HSGPA requirement of 2.5 or greater was missed only one year, 2019-2020. In the cohort year 2019-2020, a new program director was onboarded, and the program was not fully staffed. Since October 2020, UBC has been fully staffed. In Table 3, both benchmarks exceeded the goal. The goal was achieved in 5 out of 7 years.
Why is HSGPA important? For one, “A grading system is a common standard followed by universities worldwide to evaluate students’ marks and academic performance. Generally, in schools and colleges, students’ marks are evaluated as grades or percentages. In the United States of America (USA), HSGPA is used to evaluate students' academic performance. It is a standardized system followed throughout the country within different levels of education” (LeapScholar, 2022). Also, a low HSGPA can contribute to a scholar not matriculating to post-secondary education.
However, HSGPA is not the only thing that matters. College Raptor (2020) mentioned the holistic approaches universities and colleges take to evaluate applications, such as “academic rigor, application essay, demonstrated interest, ACT/SAT scores, extracurricular activities, college interviews, and community involvement/volunteer work.” Many universities use this holistic approach and more. The UBC program also utilizes a holistic approach to prepare our scholars for postsecondary enrollment and success.
UBC attended a university tour at George Mason University in 2022, and one of the recruiters informed us that one of the items for selecting and evaluating applications is the weighted HSGPAs. Therefore, academic rigor is vital in enrollment into post-secondary education. Table 6, objective 5, is the benchmark that tracks our scholars through each grant cycle concerning the rigor of secondary education. It helps scholars to receive honor scholarships and gives a better opportunity for acceptance into aggressive academic 2-year and 4-year college or university programs.
Colleges look at students’ transcripts for all 4 years of secondary education. It would send a red flag if they noticed low scores in 11th grade when a student was a straight A student in prior grades. College applications have a section explaining unforeseen circumstances that may have arisen while in secondary education. A higher education institution wants to understand any red flags because it gives a snapshot of how the student may perform as a post-secondary scholar. “The reasons for a low college grade point average are almost as varied as students themselves. Laziness, missing classes, and the inability to complete challenging work can play a role, but major life changes and stress can also interfere with good grades. Some students experience a dip in GPA due to illness, the death of a close friend or family member, disability, or financial problems. A low GPA doesn’t necessarily ruin a student’s future; the student can pull bad grades up with hard work. However, a very low GPA can have serious consequences both for their academic life and after graduation” (Thompson, 2017).
HSGPA is also essential with scholar matriculation into post-secondary enrollment because it “measures the results of months of learning while standardized testing only measures knowledge at one point in time” (Empowerly, 2018). This research also gives a strong sense of urgency because even though GPA is tracked from secondary education through post-secondary education, many high schools do not publicly make their HSGPAs available. For example, in the search for HSGPA data, Baltimore County Public Schools did not have the information on their website. Even some universities and colleges do not post the average GPA for their institution. Since this is the most common universal tracker for enrollment into post-secondary education, it should be easily obtained and transparent.
UBC uses several methodologies to monitor and intervene if necessary to ensure that the HSGPA benchmark is being upheld including monthly check-ins with their assigned program coordinator (Table 5), Tutor.com (Table 4), and virtual tutoring with faculty (Table 1). An all-hands-on-deck approach is put into play if a student slips below a 2.5 HSGPA; they are required to meet weekly with the program director until their HSGPA is above 2.5 HSGPA (Table 5). These activities help to build good academic habits and character for the UBC scholars, so that when the UBC scholars enroll in post-secondary education, without other unforeseen incidents, they will graduate post-secondary education between 4-6 years. In the current DOE grant, UBC is funded to provide services for 76 students in the target population: Baltimore County Public School students residing in zip codes 21207, 21227, 21244, and/or attending Woodlawn or Lansdowne High Schools. Two eligibility requirements are that students should be low-income, as defined by the federal government, and first generation students. Many of these individuals do not have role models to emulate. First-generation students’ parents have not attained a bachelor’s degree. When UBC scholars enroll in post-secondary 4-year universities, the skills, experiences, and knowledge obtained in this program set them up for success. At a Lansdowne High School commencement, one of the faculty members asked, “Why weren’t more high schools written into UBC’s grant?” She was especially asking about Catonsville High School (CHS). She stated, “all of the students enrolled at CHS do not have family income above the federal requirement; therefore UBC should be able to have CHS written into the UBC grants.” When the research was completed for the high schools to be considered written into the UBC grant, CHS was over the threshold for income requirements. Due to the complexity of the requirements for participation eligibility, this link is provided for more clarity: https://www.ecfr.gov/current/title-34/subtitle-B/chapter-VI/part-645/subpart-A/section-645.3
After we spoke, this educator stated that UBC scholars stand out at Landsdowne High School. As soon as a student inform her that they are a UBC scholar, she sees the difference between them and their classmates. We need more federal funding dedicated to UBC and other TRIO programs that support underrepresented students’ matriculation to post-secondary education and beyond. Data from the US Bureau of Labor Statistics (2020) shows how education attainment increases a student’s earnings potential after each degree obtained. “The chart highlights differences in 2020 earnings and unemployment rates by education, using data from the US Bureau of Labor Statistics (BLS) Current Population Survey. For example, workers with a bachelor’s degree had median weekly earnings of $1,305 in 2020, compared with $781 for workers with a high school diploma. And the unemployment rate for bachelor’s-level workers was 5.5 percent, compared with 9.0 percent for those whose highest level of education was a high school diploma” (Torpey, 2021).
Does HSGPA matter for successful enrollment into post-secondary education? YES! Without an educated population, we will fall behind other nations in providing the individuals needed for the U.S. workforce. That inflates unemployment rates. That perpetuates systemic poverty levels, and guess what? It starts with how well a scholar performs in secondary academia. The correlations to success in post-secondary education are directly tied to enrollment but even more to an individual’s potential earning capacity. HSGPA matters! It shows current and future work ethics, regardless of whether it correlates to education or a career. This information has been well tracked and studied. “An increasing number of research papers show the complicated relationship between academic achievement and career success. Earning a good grade is not only a measure of subject matter knowledge or intelligence. Instead, it’s a composite of knowledge, skills and personality traits” (Yec Council Post, 2020).
Utilizing the UBC methodology to ensure our scholars’ HSGPAs remain above 2.5 gives other educators examples of methods to emulate. Without a 2.5 or greater HSGPA, our scholar’s successful post-secondary education attainment may diminish.
ACKNOWLEDGMENTS
I want to acknowledge Jaime Bell from the Grants Office at CCBC, and Jvon Robertson of Blumen for their assistance while pulling together data from different sources. I appreciate the CCBC Librarians at Catonsville for your assistance, Deyara T. Morris Burns, MSEd, MSW for reviewing and editing, and Patrick T. Kelleher for providing Tables 7-8. Thank you!
REFERENCES
- Al Hazaa, K., Abdel-Salam, G., Ismail, R., Johnson, C., Al-Tameemi, R. A. N., Romanowski, M. H., BenSaid, A., Rhouma, M. B. H., & Elatawneh, A. (2021). The effects of attendance and high school GPA on student performance in first-year undergraduate courses. Cogent Education Journal, 8:1956857. https://doi.org/10.1080/2331186X.2021.1956857
- Allen, J., & Mattern, K. (2019). Examination of indices of high school performance based on the graded response model. Educational Measurement: Issues and Practice, 38(2), 41-52. https://doi.org/10.1111/emip.12250
- Bell, J. (2022). [Unpublished raw data on the UBC Individual Virtual Tutoring Contacts]. Community College of Baltimore County.
- Bell, J. (2022). [Unpublished raw data on Tutor.com]. Community College of Baltimore County.
- College Raptor (2020, June 18). What Is An Average GPA in America? https://www.collegeraptor.com/getting-in/articles/questions-answers/what-is-an-average-gpa-in-america/
- Community College of Baltimore County. (2015-2010). Actual Attained Rate/APR. [Unpublished raw data].
- Empowerly (2018, November 9). GPA vs Standardized Testing: Which Weighs More? https://empowerly.com/blog/gpa-vs-standardized-testing-which-weighs-more
- Formplus Blog (2022, March 18). Formative Vs Summative Assessment: 15 Key Differences & Similarities. https://www.formpl.us/blog/formative-summative-assessment
- Kelleher, P.T. (2022, July). [Unpublished raw data on Average High School GPA is calculated from students entering CCBC]. Community College of Baltimore County.
- Kelleher, P.T. (2022, July). [Unpublished raw data on Outcomes Analysis- 6 Year Model Trend of CCBC Students]. Community College of Baltimore County.
- LeapScholar Blog (2022). USA Grading System in 2022: Understanding US Grading & GPA Marking. https://leapscholar.com/blog/usa-grading-system-understanding-us-grading-gpa-marking/
- Morris, T. W. (2022). [Unpublished raw data on % = of Actual Students Enrolled]. Community College of Baltimore County.
- Robertson, J. (2022) [Unpublished raw data on Contact Summary overall (All Contacts) With Count]. Blumen.
- Thompson, V. (2017, September 26). The Consequences of a Low GPA in College. https://www.theclassroom.com/consequences-low-gpa-college-7621.html
- Torpey, E. (2021, June). Education pays, 2020. US Bureau of Labor Statistics. https://www.bls.gov/careeroutlook/2021/data-on-display/education-pays.htm
- Yec Council Post (2020, October 19). Do College Grades Predict Future Success? Forbes. https://www.forbes.com/sites/nickmorrison/2020/01/29/its-gpas-not-standardized-tests-that-predict-college-success/?sh=27a40cb132bd