The Effect of Active Participation on Online Course Performance
Henry O. Akaeze, PhD
From the Department of Behavioral and Social Sciences, School of Wellness, Education, Behavioral and Social Sciences, Community College of Baltimore County, Baltimore, Maryland.
Henry O. Akaeze, PhD
800 South Rolling Road, Baltimore, MD 21228
(443)840-4344
hakaeze@ccbcmd.edu
ABSTRACT
Student participation and engagement in online classes can have significant effects on academic performance. This study examines this relationship using survey data obtained from 2 online economics classes at the Community College of Baltimore County. A cursory exploration of the data shows that a large percent of students (33.33 %) allocates 3-5 hours each week to studying and completing other class-related activities, while 45.45 % of students regularly read the lecture materials before the class. Controlling for a student’s prior grade point average, attitude towards the course, and anticipated score, an ordinary least squares regression analysis indicates that student engagement has a positive, though not statistically significant, effect on performance.
INTRODUCTION
Student engagement refers to students’ involvement or interest during a learning exercise, and the level of interactions that exist between the students, their classes, and their institutions (Axelson & Flick, 2011; Trowler, 2010). Oftentimes, student-to-student interaction in and out of the classroom, active participation, and the level of involvement in class activities have been linked to student academic performance (Pratton & Hales, 2015).
Student participation in course delivery has a significant effect on performance. O’Connor (2013) investigated class participation and student engagement and emphasized a shift from small to large class size for participatory student interaction. Barkley (2010) also noted the increasing importance of student engagement as a gauge of student success. Using structural equation modeling, Gonzalez et al. (2021) found that student participation in academic exercises improved students’ academic performance, enhanced students’ well-being, and prevented students’ unacceptable behaviors. Song et al. (2019) further explored the "learner’s participation in online course” delivery and other synchronous methods of instruction. They found that the frequency of course access, discussion postings, and the importance of strategic communication with a virtual agent have significant effects on student achievement. These result from efficient use of technology and information dissemination, experience in the area of study, and instructional tasks (Vonderwell & Zachariah, 2014). In order to compare student performance and assessment in online and traditional methods of instruction, Ni (2013) found that student performance is “independent of the mode of instruction”. Ni also noted that while there is increased interaction in online platforms, student-to-student participation is generally “less intimidating”.
This paper centers on the engagement of students who are enrolled in an online class. Are adequately engaged students more likely to perform well in the class? Put differently, if the student’s prior GPA, attitude towards the course, and anticipated score for the class are controlled for, do well-engaged students perform better in the class than their peers? The goal of this research study, therefore, is to investigate the role student engagement plays in student academic performance.
METHODS
Survey Participants and Data Collection
A total of 33 students completed the survey in the spring of 2022. These were the students that took ECON 201 and ECON 202 online, asynchronous classes at the Community College of Baltimore County (CCBC). The students surveyed were in a combination of majors at CCBC. Fifteen students completed the survey in ECON 201 while 18 students did so in ECON 202. While it was completely anonymous, the survey was administered electronically and available from April 19, 2022 to April 30, 2022 to boost student participation. A partial list of the survey questions is provided below, and the entire survey is available upon request to the author.
| Select Survey Questions and Response Options | ||
|---|---|---|
| 1 | Which classroom activity do you enjoy the most? | Lecture videos. |
| Office hours via Microsoft Teams. | ||
| Discussion boards where you comment on your classmates? posts. | ||
| The announcement provided each week by the professor. | ||
| 2 | Which of the following would you say motivates you the most to study? | The desire to ask questions via emails. |
| Completing assignments. | ||
| Bonus questions on assignments and discussions. | ||
| Positive feedback on assignments. | ||
| Your desire to graduate with a good grade. | ||
| 3 | How much time do you set aside each week to study and do your assignments, projects, and discussions/readings? | < 1 hour |
| 1-2 hours | ||
| 2-3 hours | ||
| 3-5 hours | ||
| > 5 hours | ||
| 4 | Generally speaking, what change would you like to see in the class? | Teaching method. |
| Time taken to complete a lecture. | ||
| More time should be given to submit homework assignments and discussions. | ||
| More time for exams and quizzes. | ||
| More bonus questions. | ||
| 5 | How often do you read the lecture materials on Brightspace or MindTap before the class? | Never |
| Rarely | ||
| Occasionally | ||
| Regularly | ||
| Always | ||
Quantitative Analysis
A quantitative analysis was conducted to provide estimates on the effects of student engagement on class performance. To estimate this effect, consider the following equation:
〖Perform〗_i = α + β*〖Engage〗_i + γ'X + e_i
where 〖Perform〗_i indicates student i’s performance score in the class at the time of the survey, 〖Engage〗_i represents the student’s engagement, X is a vector of other controls which includes student’s prior GPA, attitude towards economics, and the student’s anticipated grade for the class. All these variables were obtained through the survey responses. The variable 〖Perform〗_i uses the student’s current score in the class while the variable 〖Engage〗_i is obtained by aggregating the student’s responses to questions 3 to 5 in the survey. The error term e_i denotes other factors that could affect performance that are excluded from the estimation, and α, β, and γ are parameters to be estimated. The parameter α is a constant that measures the estimated average performance score for students who have zeros for all the independent variables in the regression while γ measures the effect of other controls. The main parameter of interest is β, and its a priori expectation is positive, indicating that well-engaged students are more likely to perform well in the class.
RESULTS AND DISCUSSION
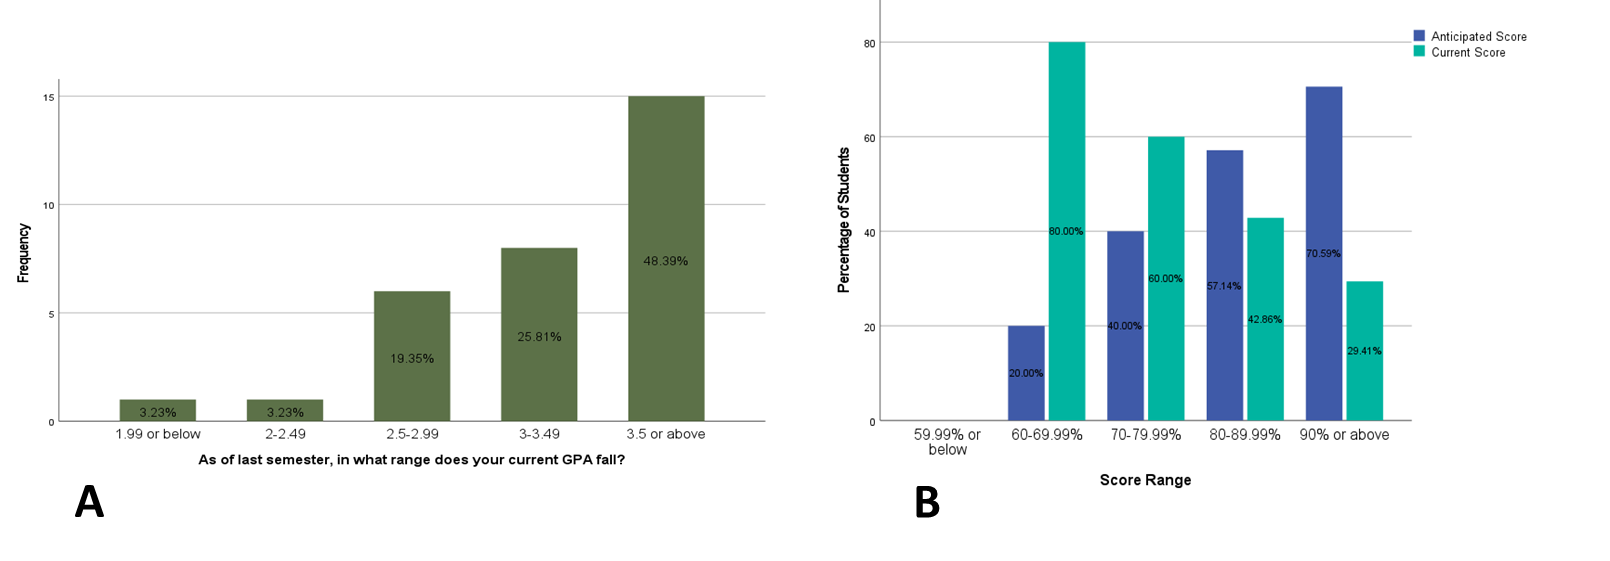
Figure 1A presents student-reported current grade point average (GPA) before the class began. As shown in the figure, 48.39% of the students reported that their current GPA was 3.5 or higher, 25.81% of the students had their GPA in the range of 3-3.49, while 3.23% had their GPA in the range of 1.99 or below. This variable (GPA as of last semester) served as one of the controls for the study.
The student current and anticipated score are displayed in Figure 1B. As the figure shows, 70.59% expected to score 90% or above (that is, “A”) but currently, that number reduced to 29.41%; 57.14% had anticipated a score of 80-89.99% (that is, “B”) but currently, that number reduced to 42.86%; and while 20% anticipated a score of 60-69.99% at the beginning of the class, that number tipped up to 80%. Therefore, the percentage of students dropped as one goes up the scale (that is, from 60-69.99% to 90% or above) for current score but rises for anticipated score. This implies that a lot of the students expected a high score at the end of the semester but currently had low scores. As the next section shows, this disparity may be explained by multiple factors including student motivation and class activity; number of hours allocated to studying and completing assignments, projects, and discussions; student communications with the professor; students readiness before the class (in the online Brightspace or MindTap programs used by CCBC); ability to complete and submit assignments, discussions, and tests before their deadlines; and overall feeling about economics and relevance of the course to their program.
Student Motivation and Class Activities
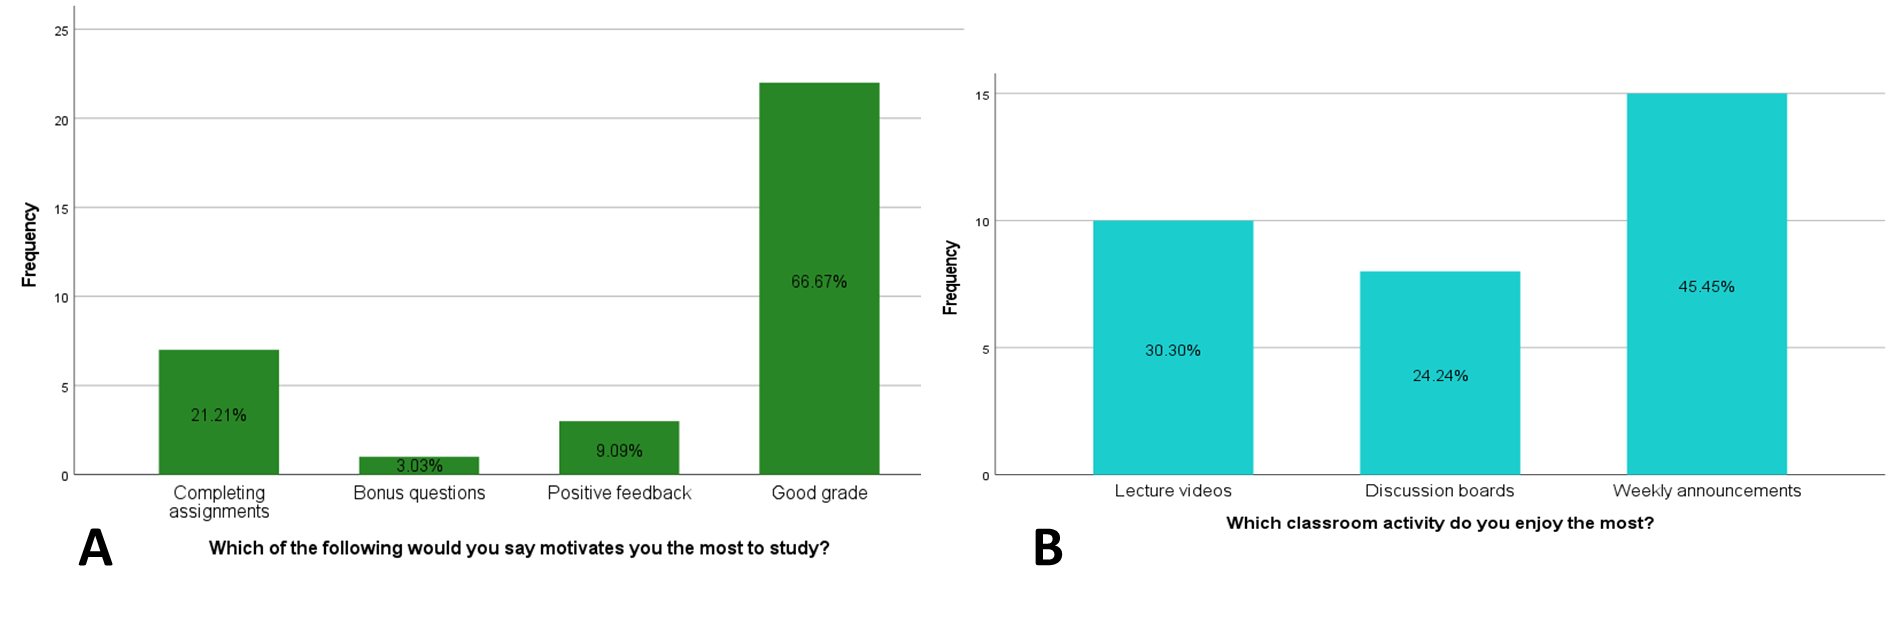
Figure 2 highlights student motivation and the classroom activity they enjoyed the most. As shown in Figure 2A, 66.67% of students indicated that a “good grade” is what motivates them the most compared to “completing assignments” (21.21%) and “positive feedback” on assignments (9.09%). This agrees with the findings of Bodkyn & Stevens (2015) and Arjani (2016) that student motivation fosters student interactions and performance in classroom activities. Regarding class activities, the students enjoyed the professor’s weekly announcement 45.46% of the time while lectures and discussion boards were enjoyed 30.30% and 24.24%, respectively. This 45.46% enjoyment rate is likely due to the fact that, in addition to specifying due dates, the weekly announcement also gave detailed information about homework assignments, discussion questions, quizzes, exams, lecture materials, and the group project. These tend to provide extrinsic motivation for completing weekly academic activities.
Number of Hours Allocated
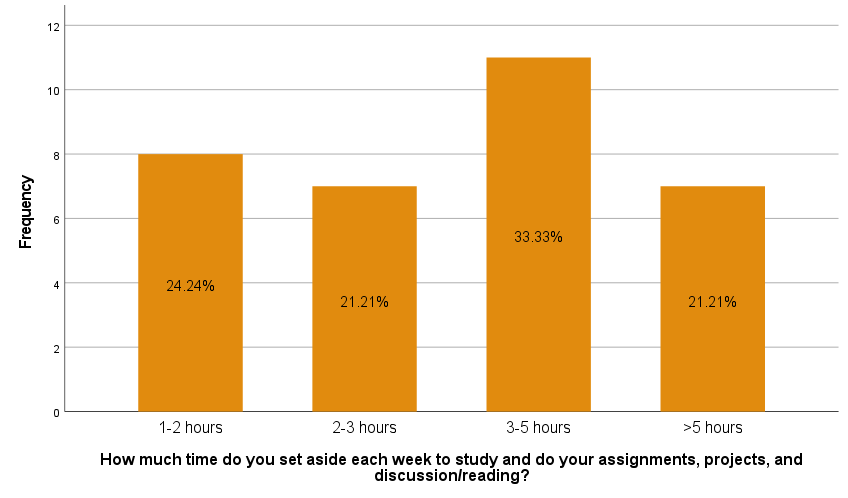
The literature suggests that time allocation is directly related with students’ grades (Grave, 2010; Razali et al., 2018). As shown in Figure 3, 33.33% of students allocate 3-5 hours each week to study and do their assignments, projects, and discussion/readings while 21.21% spend 2-3 hours and more than 5 hours. This indicates that a large number of students spend a sizable amount of time to study and complete other class-required activities.
Student Communications with the Professor
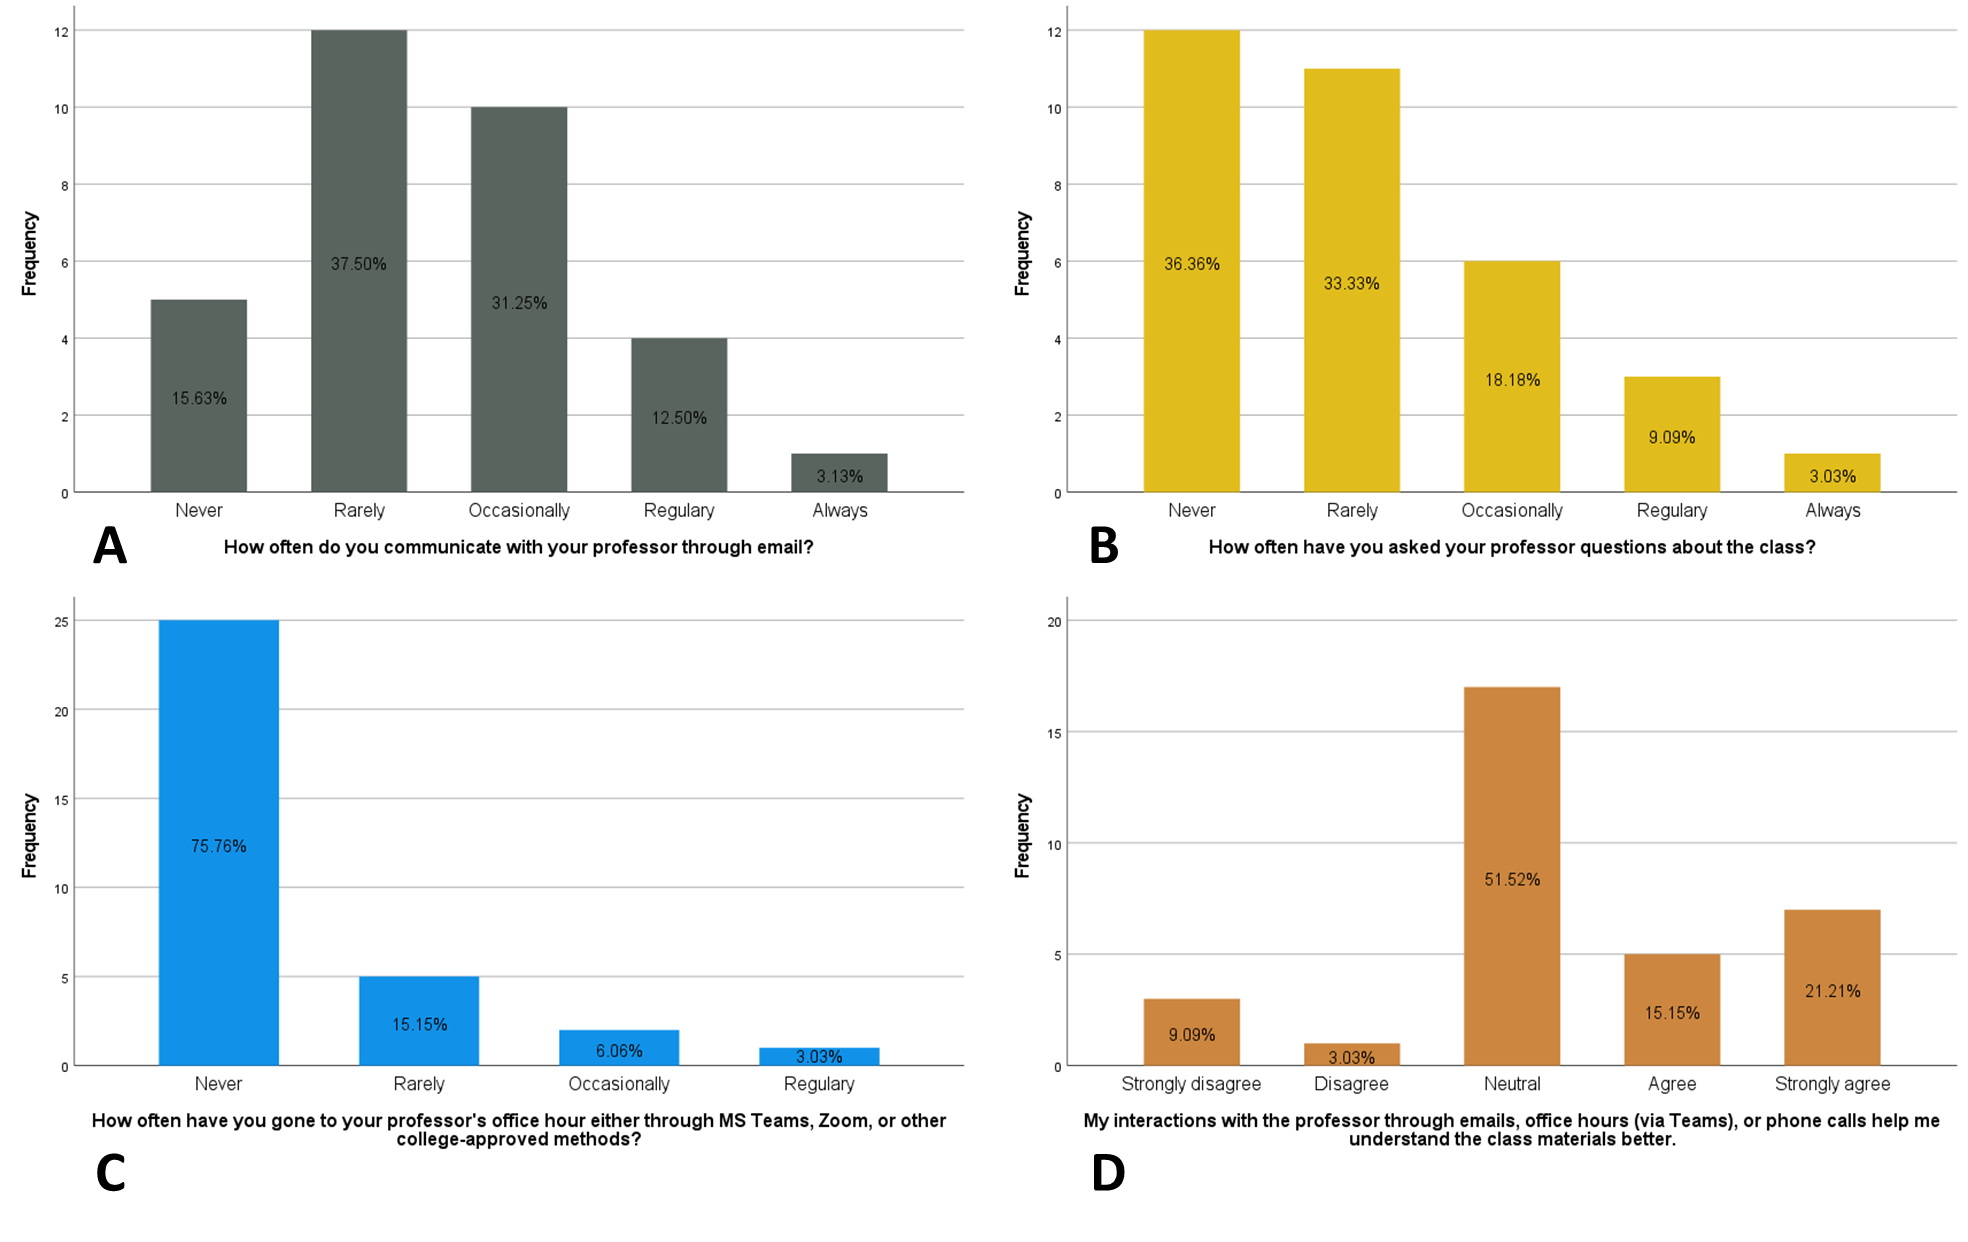
Figure 4 shows the frequency of communications through emails, questions, and office hours and students’ opinions on the utility of the communications. As shown in Figure 4A, 37.50% of the students rarely communicate with their professor, 31.25% occasionally communicate, while only 3.13% always do so. Similarly, in Figure 4B, 36.36% never asked questions about the class while 33.33% of the students rarely do so. Only 3.03% always ask questions. In Figure 4C, 75.76% of the students never went to their professor’s office hour while only 3.03% do so regularly. In Figure 4D, 51.52% of the students had a neutral response to the question of whether their interactions with the professor through emails, office hours (via Microsoft Teams), or phone calls helped them understand the class materials better. The reason for this lack of communication may be because those surveyed were online students and rarely communicate with their peers and professor.
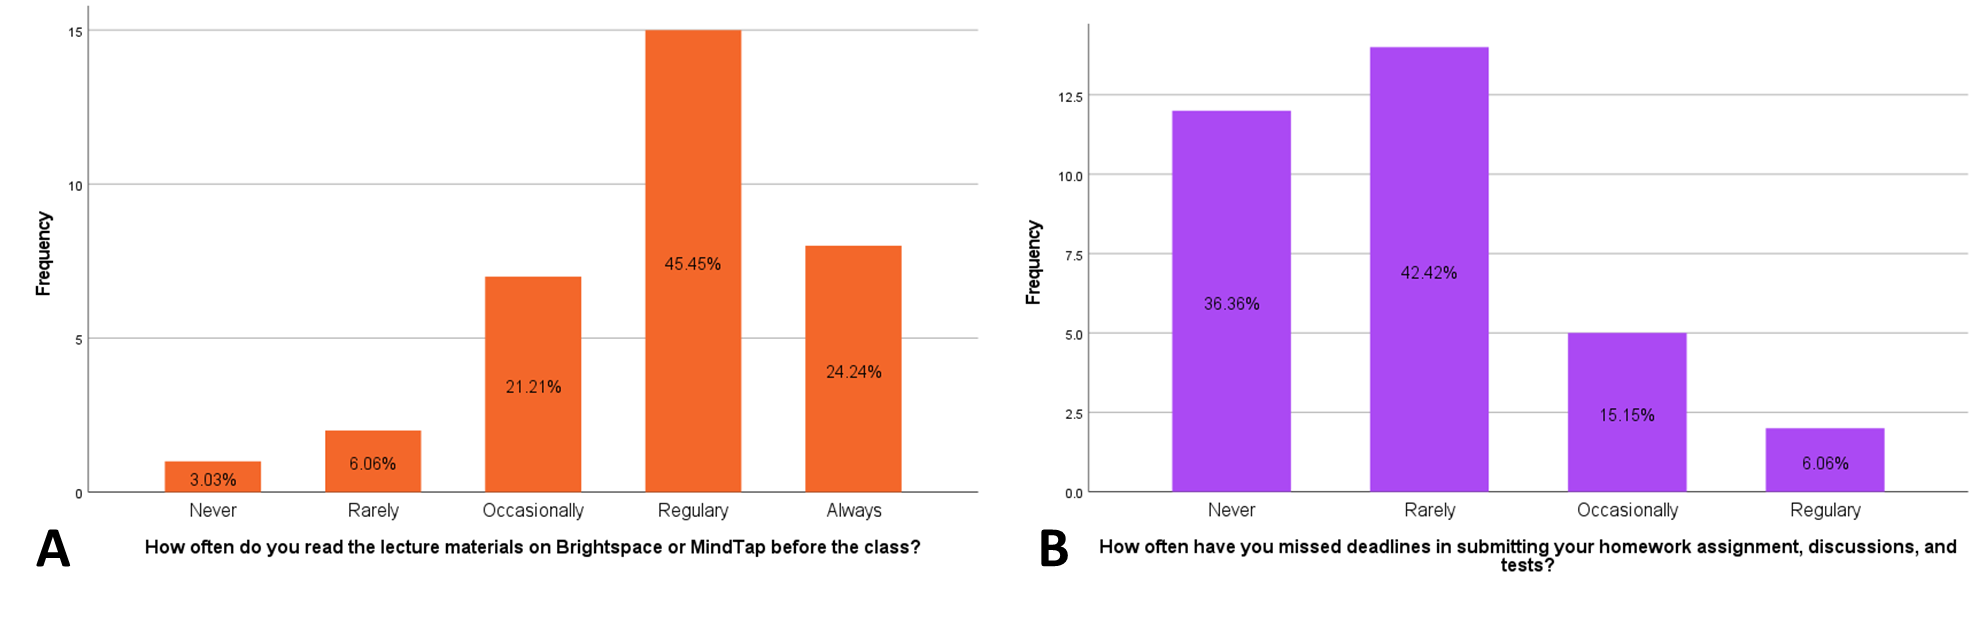
Readiness Before Class and Completion Time
Student readiness and completion time are presented in Figure 5. As shown in Figure 5A, 45.45% of the class regularly read the lecture materials on the online learning platform called MindTap, 24.24% always read the lecture materials before the class, while 3.03% never do so. In Figure 5B, about 42.42% of the students rarely miss homework, discussion, or test deadlines while 36.36% never misses the deadline. Only 6.06% do so regularly. This indicates that students actively complete the assignments, discussions, and tests on time.
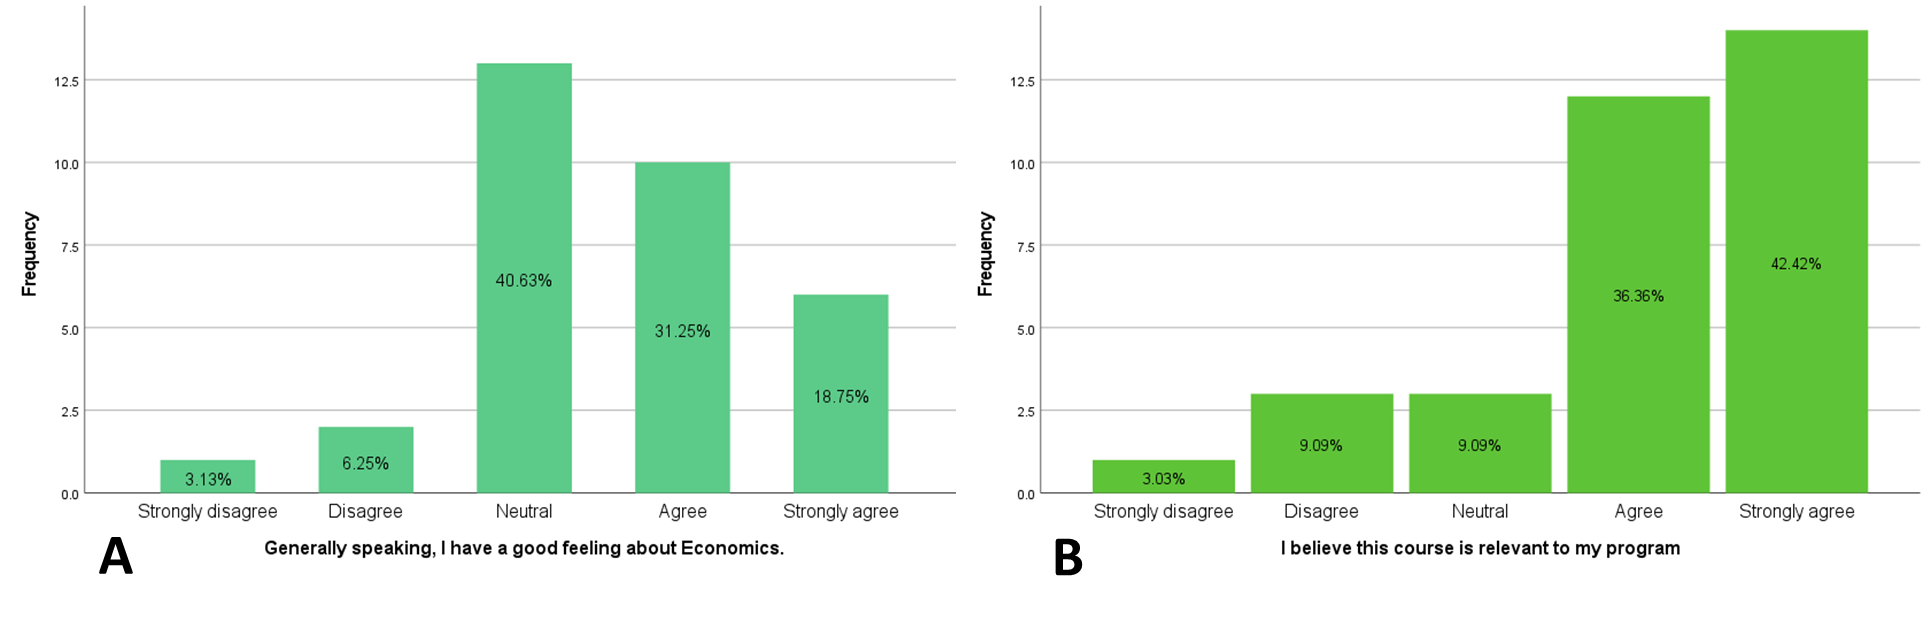
General Feelings about Economics and Its Relevance to their Program
Finally, Figure 6A indicates that 40.63% of the students are neutral when asked if they have a good feeling about economics while 18.75% strongly agree to that question. On program relevance in Figure 7B, 42.42% strongly agree that the course is relevant to their program, 36.36% agree, while 3.03% strongly disagree. This means that a large proportion of the students are taking the class due to its relevance to their program.
Summary Statistics
Some of the students had missing responses on the dependent and GPA variables, and this resulted in the list-wise deletion of 4 cases, leaving 29 cases for the regression analysis. On average, the students’ scores fall within the 2.5 GPA level whereas an average student scored a 3.13 GPA the previous semester (Table 1). The student engagement score was 1.94 on average, with higher scores indicating greater engagement with a maximum score of 3.5.
| Table 1. Summary Statistics from the Survey Responses. | |||||
|---|---|---|---|---|---|
| Variable | N | Min | Max | Mean | SD |
| What range does your score in this class fall right now? | 30 | 1 | 4 | 2.50 | 0.938 |
| As of last semester, in what range does your GPA fall? | 31 | 0 | 4 | 3.13 | 1.056 |
| What range did you anticipate your score to be at the beginning of the class? | 33 | 1 | 4 | 3.06 | 0.864 |
| Student engagement score | 33 | 1.13 | 3.50 | 1.94 | 0.532 |
| Generally speaking, I have a good feeling about economics. | 33 | 0 | 4 | 2.48 | 1.064 |
| Abbreviations: GPA = grade point average; N = number of responses; SD = standard deviation. | |||||
The correlation between the student’s current score and major variables are reported in Table 2. All the variables (attending office hours, questions via discussion board, and ability to communicate with the professor through email) are negatively correlated with the student’s current score. For example, the correlation coefficient between the ability to communicate with the professor through emails and current score is -0.1824. This is because only 3.13% of students always communicate with the professor through emails, whereas 37.50% of the students rarely do so.
| Table 2. Correlation Coefficients between Current Course Grade and Major Variables. | ||||
|---|---|---|---|---|
| Current score | Attending office hours | Questions via discussion boards | Communication with the professor through emails | |
| Current score | 1.0000 | |||
| Attending office hours | -0.10234 | 1.0000 | ||
| Questions via discussion boards | -0.1513 | -0.0000 | 1.0000 | |
| Communication with the professor through emails | -0.1824 | 0.4490 | 0.3154 | 1.0000 |
Regression results
The effect of student engagement on student performance was estimated using the ordinary least squares procedure. The regression model uses the current score in the class as the dependent variable while student engagement is the main independent variable of interest. This variable was obtained by averaging the responses to questions 3 to 5 in the survey to yield an aggregate score for students engagement. Each response was coded by a number from 0 to 4, and then averaged. The higher the score on the engagement variable, the greater the student’s engagement in course-related activities. Note that the question on how often a student misses a deadline was reverse-coded before combining it with the other questions used to derive the engagement variable.
As shown in Table 3, only the anticipated score for the overall class is significant at the 10% level. Overall, controlling for a student’s prior GPA, attitude towards economics, and their anticipated final grade for the class, the effect of student’s engagement on their current score is positive and follows a priori expectation. However, the associated p-value is high (p-value = 0.772), indicating the effect is not significant.
| Table 3. Ordinary Least Squares Regression Results for Key Variables. | |||||
|---|---|---|---|---|---|
| Beta | Standard Error | Standardized Beta | t-statistic | p-value | |
| (Constant) | -0.057 | 1.058 | -0.054 | 0.957 | |
| GPA as of last semester | 0.224 | 0.162 | 0.253 | 1.380 | 0.180 |
| Student engagement | 0.093 | 0.317 | 0.052 | 0.293 | 0.772 |
| Anticipated score for class | 0.409 | 0.203 | 0.377 | 2.015 | 0.055 |
| Feeling towards economics | 0.162 | 0.146 | 0.191 | 1.106 | 0.280 |
| Abbreviation: GPA = grade point average. | |||||
CONCLUSION
While it might be concluded that student engagement has no effect on student performance, there are a number of reasons that conclusion may be flawed. First, this study uses survey responses from online-only students and does not account for in-class activities. Engagement in online classes is remarkably different from in-class courses, and so the results of this study may not generalize to in-class engagement behavior.
Researchers who are interested in assessing engagement in online classes resort to tracking information from online activities on the course platform and/or retrieving students’ reported rating of their engagement, and these may sometimes be unreliable. The accuracy of the results reported in this study are therefore dependent on the veracity of the students’ report of their engagement. Second, the lack of significance is not surprising, given the small sample size used in the study. The small class size for this course posed a significant constraint on the sample size for this study, so increasing the sample size was not feasible. The study would benefit from a large-scale study to get a better understanding of the impact of student engagement on academic performance.
Third, in addition to the sample size limitation, the dependent variable (current score in the class) was measured as an ordinal variable to enhance anonymity and encourage students to provide that information. This form of measurement could have masked significant information in the dependent variable. More research needs to be done to appropriately understand the effect of student engagement on academic performance.
REFERENCES
- Ariani, D. (2016). Why do I study? The mediating effect of motivation and self-regulation on student performance. Business, Management and Education, 14(2), 153-178.
- Axelson, R. D., & Flick, A. (2010). Defining student engagement. Change: The Magazine of Higher Learning, 43(1), 38-43. https://doi.org/10.1080/00091383.2011.533096
- Barkley, E. F. (2010). Student engagement techniques. A Handbook for College Faculty. The Jossey-Bass Higher and Adult Education Series.
- Bodkyn, C., & Stevens, F. (2015). Self-directed learning, intrinsic motivation and student performance. Caribbean Teaching Scholar, 5(2), 79-93.
- González, C., Varela, J., Sánchez, P. A., Venegas, F., & Tezanos-Pinto P. (2021). Students’ participation in school and its relationship with antisocial behavior, academic performance and adolescent well-being. Child Indicators Research, 14, 269-282. https://doi.org/10.1007/s12187-020-09761-5
- Grave, B. S. (2011). The effect of student time allocation on academic achievement. Education Economics, 19(3), 291-310. https://doi.org/10.1080/09645292.2011.585794
- Ni, A. Y. (2013). Comparing the effectiveness of classroom and online learning: Teaching research methods. Journal of Public Affairs Education, 19(2), 199-215.
- O’Connor, K. (2013). Class participation: Promoting in-class student engagement. Education, 5(3), 340-344.
- Pratton, J., & Hales, L. W. (2015). The effects of active participation on student learning. The Journal of Educational Research, 79(4), 210-215.
- Razali, S. N. A. M., Rusiman, M. S., Gan, W. S., & Arbin, N. (2018). The impact of time management on students’ academic achievement. Journal of Physics: Conference Series, 995(1). https://iopscience.iop.org/article/10.1088/1742-6596/995/1/012042
- Song, D., Rice, M., & Oh, Y. (2019). Participation in online courses and interaction with a virtual agent. International Review of Research in Open and Distributed Learning, 20(1), 43-62.
- Trowler, V. (2010). Student engagement literature review. The Higher Education Academy, 11(1), 1-15.
- Vonderwell, S., & Zachariah, S. (2014). Factors that influence participation in online learning. Journal of Research on Technology in Education, 38(2), 213-230.