Open Educational Resources and Educational Outcomes at a Community College
Timothy S. Faith, JD1, and Glenda Breaux, PhD2
From the 1Legal Studies Department, School of Business, Technology and Law, and 2Planning, Research and Evaluation, Community College of Baltimore County, Baltimore, Maryland.
Timothy S. Faith, JD - Corresponding Author
tfaith@ccbcmd.edu
ABSTRACT
Open educational resources (OERs) are an alternative textbook to publisher materials used by colleges and universities. While OERs likely reduce the cost of college for students, research is mixed on the impact of these textbooks on student success in college. The present study utilizes preference score matching (PSM) methodology to compare OER and publisher textbook use to student pass and withdrawal rates from 9 high-enrollment courses taught at the Community College of Baltimore County from fall 2016 through spring 2021. We examined all enrollments in a subclass-match PSM model, and found a significant improvement of 0.153 on the final course grade received by the student, and a significant increase of about 4% for students that received an ABC in courses using the OER, along with a significant decrease of 2.6% in the rate that students withdrew from OER courses. We also examined Pell students in a subclass-match PSM model, and found a significant improvement of 0.331 on the final course grade received by the Pell student, and a significant increase of about 9% for students that received an ABC in courses using the OER, along with a significant decrease of 4.8% in the rate that Pell students withdrew from OER courses.
INTRODUCTION
As a follow-up on prior research, the authors undertook a more extensive review of courses at a large, Mid-Atlantic Community College (the Community College of Baltimore County), in an effort to evaluate the impact of using open educational resources (OERs) on student outcomes (Faith et al., 2021). The following is a more comprehensive review of a wider array of independent variables across a larger number of highly enrolled courses that used a publisher textbook and subsequently used an OER text. The objective of this study is to examine whether variations in student outcomes are explained by OER use in these courses.
An instructor’s key concern is guiding students to demonstrate the course’s stated learning objectives. The course textbook is one of the fundamental tools used by instructors across many disciplines and institutions nationally, and therefore, the accuracy, quality, and accessibility of the textbook for students is of substantial concern to the instructor. The literature report concerns from some faculty that OERs are in some form lesser than publisher textbooks, and as a consequence, OERs will not help students to attain the course learning objectives at the same rate as compared with traditional textbook-based courses. However, the literature also reports a substantial equity concern for students as to the cost of publisher textbooks, and the disparate impact of this cost on students of more moderate means. The literature also reports divergent student outcomes for courses and institutions adopting OER textbooks (Clinton & Khan, 2019). This paper contributes to the growing body of literature on the impact of OERs on student learning outcomes in examining a wider scope of independent variables for a wider array of highly enrolled courses offered by a large, regional community college.
The authors hypothesized that the use of OER materials would result in improved student outcomes across the courses in the study, either because the reduced cost of the materials would reduce a barrier for students to access them for the course, or because the OER materials were superior to traditional textbooks as the OER materials were tailored to the course objectives of those courses adopting them. Numerous studies have discussed the former, identifying that the growing cost of publisher materials results in students foregoing the textbook but remaining in the course and/or subsequently withdrawing, likely to the student’s detriment (Clinton & Khan, 2019). Research question 1 was whether OERs had a significant impact on student success or withdraw rates for students enrolled in one of the identified highly enrolled courses that had implemented an OER during the study period.
METHODS
The authors began this analysis by collecting data on students enrolled in specific courses between the fall 2016 and spring 2021 semesters. The authors targeted highly enrolled courses at the Community College of Baltimore County which had implemented an OER textbook during the period, to compare the impact on student learning outcomes before and after the OER text was adopted. Table 1 describes the courses included in the study, and the date each one adopted an OER text. The study itself is constructed as an observational study, rather than a randomized controlled trial, of the OER textbook as the treatment, because a randomized study of this scale in an educational setting would be infeasible (Adelson, 2013).
Observational studies at their outset create a strong possibility of bias due to confounders in the observed data, where a baseline covariate within the population may be the true cause of the observed result, rather than the treatment being analyzed by the study (Austin, 2011). In a randomized controlled trial, an unbiased estimate of the average treatment effect can be calculated by a difference of the means of outcomes between the control and treated populations. However, an observational study’s control and treatment groups may vary such that other covariates, including, for example, the age, family income, or race distribution of each group, may bias the difference between the observed means. One methodology discussed in the literature to counter this problem is the use of a propensity score.
Rosenbaum and Rubin (1983) originally developed the propensity score as expressed in the following formula: ei = P r (Zi = 1|Xi), where ei is the preference score of the individual, i, Xi is a vector of features or characteristics for individual i, and Zi is a binary variable indicating whether or not individual i is a match. The purpose of calculating a propensity score is to create a similar treatment and control group so that the distribution of known covariates is similar between the 2 groups (Austin, 2011) such that “in a set of subjects all of whom have the same propensity score, the distribution of observed baseline covariates will be the same between the treated and untreated subjects.” The output from a properly matched treatment and control group is the average treatment effect on the treated (ATT). Fischer’s implementation of propensity score matching (PSM) was “to create subsets of students who were statistically similar across three important covariates: age, gender, and minority status” by regressing the bivariate treatment condition on these covariates and matching using “nearest neighbor matching with calipers” to create homogenous treatment and control groups (Fischer, 2015).
Concerns, however, remain in implementing PSM in the educational setting because there are so many variables that may significantly impact a student’s performance in a course. An accurate ATT depends on careful consideration of all relevant variables that may impact student course outcomes. Otherwise, the study may present an analysis where an undiscovered bias may better explain differences between treatment and control groups than the treatment applied to the study, such as the use of an OER textbook. Alyahyan and Düştegör (2020) identified numerous factors that may correlate with student success, including (a) past student performance such as high school grade point average (GPA) and/or student grade point average in prior college courses; (b) student demographics such as gender, race, and socioeconomic status; (c) the type of class, semester duration, and program of study; (d) psychological factors of the student such as student interest, stress, anxiety, and motivation; and (e) e-learning data points such as student logins to the learning management system (LMS) and other student LMS activity.
We began at the outset with a larger dataset of potential covariates that might explain student performance in courses, including the cumulative GPA of the student which we collapsed into GPA ranges to simplify our model (the GPA ranges were 0.5 steps of GPA, such that GPAs between 3.75 and 4.0 were rounded to 4, 3.25 to 3.74 were rounded to 3.5, 2.75 to 3.24 were rounded to 3, and so forth). We also included student demographic variables including age, gender, race, Pell status as an indicator of socioeconomic status, and whether the student was new first time, returning, or a transfer student (new first time college students also encompass high school students that began taking college courses while in high school). Finally, we also included whether the course was taught in person, the overall hours attempted and earned by the student, and the course level of the course. We then examined median course grades across these covariates, finding that: (a) median grades for White and Asian students were generally higher than other ethnic backgrounds, (b) median grades for females students were higher than male students, (c) median grades for Pell students were higher than for non-Pell students, (d) median grades for transfer students were higher than for new first time and returning students, and (e) median grades for younger students tended to be higher than for older students, where the median age of students was 20 within the study. We also discovered that other variables, such as the cumulative credits earned by a student, were not correlated with course outcomes, and therefore excluded these variables from assigning a preference score. This initial analysis guided us in developing an appropriate preference score for each student for matching as discussed below.
Another methodology barrier is the use of datasets with duplicated students, given that students may re-enroll in a course and change their cumulative GPA during the 5-year period of the study. Some studies (Fischer, 2015; Winitzky-Stephens 2017) avoided this issue by using a PSM approach to define control and treatment groups, as noted above, while other studies utilized a multilevel modeling approach, such as in Winitzky-Stephens, which, according to the authors of that study, would ameliorate the contamination issue. Other studies did not address the problem of duplicated students within their dataset, such as Colvard, or were limited to a single instructor’s implementation of OER in a course and therefore duplicated students were probably few (Colvard, 2018; Hilton, 2019).
Given the size of the present data set and the use of a number of highly enrolled courses at the College that may be required in multiple majors, a substantial number (15,383) of enrollments are associated with duplicate students (with an individual student appearing up to 7 times in the data set as a result of taking different classes, repeating a particular course for a better grade, or both). PSM addresses this issue of duplicated students within the overall dataset.
Hilton identified an additional methodology issue of teacher bias in a meta-study of published OER research (Hilton, 2019). Variation in student grades could potentially be correlated with variances in faculty grading standards, thereby contaminating analysis of the impact of a treatment such as the use of OER textbooks on student outcomes. Hilton identified 5 studies that effectively controlled for teacher bias by having the same faculty person teach the course using traditional publisher materials, and later teaching the course using OER materials (Hilton, 2019).
To control for the possibility of teacher bias, the authors only included enrollment from individual courses that were taught by instructors that had used both a publisher textbook and OER materials during the study period. This resulted in a total of 29,821 enrollments initially included in the analysis. A total of 105 faculty were included in this analysis by meeting the criteria of (a) teaching 1 of the 9 courses included in the study, and (b) teaching the course using both a publisher and OER text during the study period.
An institutional database source was queried for the raw data included in this analysis and exported into a MySQL database, where the data was processed to homogenize study variables, and such processed data was statistically analyzed using R version 4.2.2. Certain independent variables were converted to a binary value for the analysis, such as gender, race (set as 1 if the student was White or Asian, and 0 for all other ethnicities), Pell eligibility, whether the course was taught in-person, and whether the student had transferred from another college or university. As noted above, GPA was simplified into categories based on rounding to a half grade point.
Three dependent variables were defined: (a) whether the student withdrew from a course, (b) whether a student earned an ABC in the course, and (c) the final grade in the course coded such that an A was coded as 4, B as 3, C as 2, D as 1, and all other final grades as 0.
The institutional data source indicated whether a student enrollment had only been exposed to publisher textbooks and was identified as belonging to the control group. The data source also indicated whether the student had only been exposed to OER textbooks and was identified as belonging to the pure group. Students exposed to both OER and publisher textbooks were marked as belonging to the mixed group. To further refine OER exposure, an application was developed that examined each enrollment based on the course and the semester and indicated whether that particular enrollment was in a course that utilized a publisher or control textbook based on the adoption date identified from the research of one of the authors. Enrollments were subsequently coded as either a part of the treatment or not based on whether the enrollment was associated with a course that utilized the OER text.
The MatchIt function was utilized in R to develop a propensity score match of students who enrolled in an OER-based course, with similar students enrolled in a control course, using the following independent variables: (a) whether the student was female, (b) whether the student was White or Asian, (c) the student’s GPA category, (e) whether the student was a transfer student, (f) whether the student received a Pell grant, and (g) whether the course was in-person.
We next attempted several different matching algorithms with the dataset to find the best overall match of students from the treatment group to the control group. We first attempted a nearest propensity score matching with a caliper of 0.1 with a propensity score estimated using glm regression of the treatment on the covariates, however, this achieved poor balance overall as the standard pair distance exceeded 0.1 for most of the covariates (Griefer, 2022; Ho, 2011). We also used exact and coarse exact match matching, but both of these resulted in some discarded treated observations in the study, which might limit the results to a statement of the average treatment on the matched (Griefer, 2022).
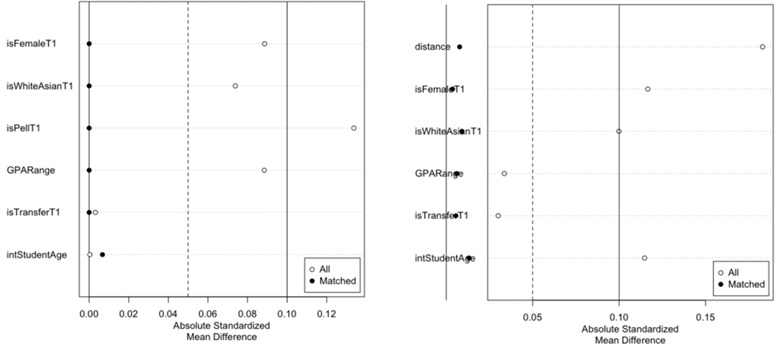
We then attempted a subclass propensity score matching which achieved a standard pair distance of less than 0.1 for all covariates, as more fully described in Figure 1a, for all students included in the study; no observations were discarded. For the Pell-only model, we also used a subclass propensity score which resulted in adequate balance of the control and treatment groups as more fully described in Figure 1b; no observations were discarded.
To estimate the treatment effect and its standard error, we fitted a linear regression model with whether the student succeeded in the course (by earning an A, B, or C) as the outcome, and the treatment, covariates, and their interactions as predictors, and then included the full matching weights in the estimation. The lm function was used to fit the outcome, and the comparisons function in the marginaleffects library was used to perform a g-computation in the matched sample to estimate the ATT. A similar linear regression model was created to evaluate whether the student withdrew from the course and the overall course grade earned by the student (Griefer, 2022). Matching was performed using the MatchIt package (Ho, 2011) in R, which calls functions from the Matching package (Diamond & Sekhon, 2013; Sekhon, 2011). Figures were generated within R using the ggplot2 library.
RESULTS
Table 1 summarizes the enrollment by course that was included in this analysis of OER use. The reader will note the duplicated students are included in this dataset. A total of 20,935 unduplicated students were included in the study, with students taking between 1 and 7 courses included in the study (median enrollment was 1 course per student with a standard deviation of 0.73; a total of 1,799 students were enrolled in 3 or more courses in the study). Courses were selected based on high enrollment during the review period of fall 2016 through spring 2021, and implementation of an OER text at some point during the 5-year period. Individual sections were excluded where instructors did not teach the course using both a publisher text and an OER text later. All courses included in this study are 100-level courses or lower. A total of 29,821 enrollments across these 9 highly enrolled courses were included in the study, with 9,590 enrollments in the control (publisher) textbook group, 11,649 enrollments in OER-only textbook group, and 8,566 enrollments that took classes that used both publisher textbooks and OER textbooks during the study period. At the course level, 14,985 enrollments were associated with courses that had implemented an OER during the study period, with the balance associated with those same courses while utilizing a publisher textbook.
Tables 2-4 summarize student success based on their OER exposure during the study period. Table 2 shows the overall percentage of students that received an ABC grade in each of the 3 groups in the study. Enrollments only exposed to OER courses had a success rate of 59%, whereas enrollments in the control and mixed groups had an overall success rate of 63%. The decline in success rates by course is generally consistent with the overall decline in comparing the control and OER-only groups as described in Table 4 (with the exception of the ESOL 054 course, where the two success rates are the same).
Table 5 shows the overall percentage of Pell students (n = 4,143) that received an ABC in each of the 3 groups in the study. Pell status in the study is used as a proxy for the socioeconomic status of students as students eligible for a Pell grant must have a relatively low expected family contribution as calculated from the student’s FAFSA submission. The authors theorized that the availability of low/no-cost OER materials would improve Pell student success, as the cost of publisher materials may pose a barrier to low-income students. Table 5 illustrates that the success rate of Pell students in the control group was 66%, whereas the success rate in the mixed group was 69% and the success rate was 71% in the Pure OER group.
To address the issue of co-variants in the data, the authors proceeded to conduct a PSM analysis, matching treatment enrollments with control enrollments based on several independent variables that can be associated with student success, as noted above in the methodology. We then proceeded to analyze the ATT of the treatment on student success, defined as both whether the student received an ABC, whether the student withdrew from the course, and the final course grade earned.
The results of the PSM matching analyses are summarized in Table 6 for all students included in the study, and in Table 7 for Pell-eligible students. The use of OER textbooks appears to show a significant positive impact on student success rates for all students and Pell-only students, and a significant reduction in the rate at which students withdraw from classes in both models.
DISCUSSION AND CONCLUSION
Student success is an important aspect of the college experience of the student. As faculty, we strive to implement improvements in our courses that support the success of students. OERs are a widely adopted intervention, boosted by the idea that reduced-cost textbooks that are otherwise of similar quality to publisher texts reduce a barrier to student learning. On first examination, our analysis does not support this notion. A review of the data in Tables 2 & 4 suggest that almost across the board, students that are just exposed to OER textbooks are less likely to receive a passing grade in the 9 courses we included in this study, even though students who receive Pell grants (a minority of the student enrollments included in the study) seem to more frequently receive a passing grade in courses with an OER textbook.
However, there are substantial covariates that impact student performance in college courses which may be confounded with the OER textbook treatment. To address this concern, we implemented a PSM approach to modeling the data and to estimate an ATT of the OER on student performance. Using a subclass matching method, we were able to match control and treatment units based on 6 covariates: whether the student was female, whether the student was White or Asian, the GPA range of the student, whether the student was a transfer student from another college or university, whether the student was a Pell grant recipient, and the age of the student enrolled in the course. The estimated ATT for students using OER textbooks was a significant improvement of 0.153 (on average, a 6th of a letter grade improvement) on the final course grade received by the student, and a significant increase of about 4% for students that received an ABC in courses using the OER, along with a significant decrease of 2.6% in the rate that students withdrew from OER courses.
The impact on Pell-eligible students, however, was more substantial, when we matched using 5 covariates: whether the student was female, whether the student was White or Asian, GPA range of the student, whether the student was a transfer student, and the student’s age. The estimated ATT for students using OER textbooks was a significant improvement of 0.331 (on average, about a 3rd of a letter grade improvement) on the final course grade received by the Pell student, and a significant increase of 9.2% for students that received an ABC in courses using the OER, along with a significant decrease of 4.8% in the rate that Pell students withdrew from OER courses.
Interpretations of impact on overall student course grades should be approached with caution. As discussed by Grimaldi (2019), OER researchers have hypothesized that student course grades would improve after implementation of OER because the cost of publisher textbooks was a barrier to accessing the textbook, yet studies of the impact of OERs on final course outcomes is mixed. Grimaldi points out that this may be because most empirical studies of student outcomes do not assess the level at which students had access to publisher textbooks previously and therefore could not compare the level of access attained by implementing an OER, even though the level of access to textbooks may better explain changes in course grades. The other hypothesis of OER researchers has been that OER textbooks should be superior in quality to publisher books, therefore students should perform better in OER courses for this reason. This study does not attempt to evaluate whether OERs are superior in terms of their content or student comprehension of course materials, though the superiority or inferiority of one textbook over another could very well explain variations in course outcomes. The conundrum is that any combination of these variables – access to textbooks and quality of textbooks – could explain course grade changes between publisher and OER textbooks, but neither variable was available to this study.
Second, the literature notes a number of other independent variables that may impact student performance in courses, but not all of these variables were available to this study to match control and treatment units, such as certain psychological factors and student LMS activity.
Finally, the study period includes the start of the global COVID-19 pandemic, which resulted in the sudden shift of students to online learning. We did not include this change as a study variable, though it is possible that the sudden change in instructional modality may have impacted student success and withdraw rates during that period.
REFERENCES
- Allen, G., Guzman-Alvarez, A., Molinaro, M., & Larsen, D. (2015). Assessing the impact and efficacy of the Open-Access ChemWiki Textbook Project. EDUCASE. https://library.educause.edu/resources/2015/1/assessing-the-impact-and-efficacy-of-the-openaccess-chemwiki-textbook-project
- Angelino, L.M., Williams, F. K., & Natvig, D. (2007). Strategies to engage online students and reduce attrition rates. The Journal of Educators Online, 4(2), 1-14. https://eric.ed.gov/?id=EJ907749
- Alyahyan, E., & Düştegör, D. (2020). Predicting academic success in higher education: Literature review and best practices. International Journal of Educational Technology in Higher Education, 17(3). https://doi.org/10.1186/s41239-020-0177-7
- Clinton, V., & Khan, S., (2019). Efficacy of open textbook adoption on learning performance and course withdrawal rates: A meta-analysis. AERA Open, 5(3). https://doi.org/10.1177/2332858419872212
- Colvard, N., Watson, C. E., & Park, H. (2018). The impact of open educational resources on various student success metrics. International Journal of Teaching and Learning in Higher Education, 30(2), 262-276. https://eric.ed.gov/?id=EJ1184998
- Diamond, A., & Sekhon, J. S. (2013). Genetic matching for estimating causal effects: A general multivariate matching method for achieving balance in observational studies. The Review of Economics and Statistics, 95(3), 932-945. doi:10.1162/REST_a_00318
- Faith, T. S., Mandl, D., & Burke, J. (2021). Open educational resources in business law: Notes from the field. Teaching and Learning Excellence through Scholarship, 1(1). https://doi.org/10.52938/tales.v1i1.1358
- Fischer, L., Hilton, J., & Robinson, T. J. (2015). A multi-institutional study of the impact of open textbook adoption on the learning outcomes of post-secondary students. Journal of Computing in Higher Education, 27, 159-172. https://doi.org/10.1007/s12528-015-9101-x
- Grimaldi, P. J., Mallick, D. B., Waters, A. E., & Baraniuk, R. G. (2019). Do open educational resources improve student learning? Implications of the access hypothesis. PLOS One, 14(3). https://doi.org/10.1371/journal.pone.0212508
- Hendricks, C., Reinsberg, S. A., & Rieger, G. W. (2017). The adoption of an open textbook in a large physics course: an analysis of cost, outcomes, use and perceptions. The International Review of Research in Open and Distributed Learning, 18(4). https://doi.org/10.19173/irrodl.v18i4.3006
- Hilton, J. L., & Laman, C. (2012). One college’s use of an open psychology textbook. Open Learning: The Journal of Open, Distance and e-Learning, 27(3), 265-272. https://doi.org/10.1080/02680513.2012.716657
- Hilton, J. L. (2014). Cost-savings achieved in two semesters through the adoption of open educational resources. The International Review of Research in Open and Distributed Learning, 15(2), 1-18. https://doi.org/10.19173/irrodl.v15i2.1700
- Hilton, J. (2019). Open educational resources, student efficacy, and user perceptions: a synthesis of research published between 2015 and 2018. Educational Technology Research and Development, 68, 853-876. https://doi.org/10.1007/s11423-019-09700-4
- Ho, D., Imai, K., King, G., & Stuart, E. A. (2011). MatchIt: Nonparametric preprocessing for parametric causal inference. Journal of Statistical Software, 42(8), 1-28. https://doi.org/10.18637/jss.v042.i08
- Lovett, M., Meyer, O., & Thille, C. (2008). The open learning initiative: Measuring the effectiveness of the OLI statistics course in accelerating student learning. Journal of Interactive Media in Education, 2008(1), Article 13. http://doi.org/10.5334/2008-14
- Patterson, B., & McFadden, C. (2009). Attrition in online and campus degree programs. Online Journal of Distance Learning Administration, 12(2), 1-9. https://eric.ed.gov/?id=EJ869274
- Sekhon, J. S. (2011). Multivariate and propensity score matching software with automated balance optimization: The matching package for R. Journal of Statistical Software, 42(1), 1-52. https://doi.org/10.18637/jss.v042.i07
- Senack, E. (2014). Fixing the broken textbook market: How students respond to high textbook costs and demand alternatives. Center for Public Interest Research, Inc. https://uspirg.org/sites/pirg/files/reports/NATIONAL%20Fixing%20Broken%20Textbooks%20Report1.pdf
- Winitzky-Stephens, J., & Pickavance, J. (2017). Open educational resources and student course outcomes: A multilevel analysis. International Review of Research in Open and Distributed Learning, 18(4), 1-15. https://doi.org/10.19173/irrodl.v18i4.3118
- Zhao, Q.-Y., Luo, J.-C., Su, Y., Zhang, Y.-J., Tu, G.-W., & Luo, Z. (2021). Propensity score matching with R: conventional methods and hew features. Annals of Translational Medicine, 9(9), 812. https://atm.amegroups.com/article/view/61857
| Table 1. Courses and Adoption Semester of OER. | ||||
|---|---|---|---|---|
| Course | Description | Adoption semester | Study enrollment | |
| WMST 101 | Intro to Women’s Studies | fall 2019 | 1,158 | |
| ESOL 054 | Academic ESOL Reading | spring 2018 | 1,000 | |
| FAPA 101 | Intro to Fine & Performing Arts | fall 2017 | 936 | |
| PSYC 101 | Intro to Psychology | fall 2017 | 11,643 | |
| MNGT 140 | Business Law I | fall 2017* | 1,870 | |
| CHEM 107 | Fundamentals of Chemistry | fall 2018** | 4,083 | |
| MATH 135 | Applied Algebra & Trigonometry | fall 2020 | 922 | |
| MATH 153 | Intro to Statistical Methods | fall 2015*** | 5,614 | |
| MATH 163 | College Algebra | fall 2016*** | 2,579 | |
|
* = specific faculty piloted the OER in fall 2017 & spring 2018, and then all faculty began use of the OER text starting in the fall 2018 semester.
** = faculty returned to publisher textbook in the spring 2020 semester. *** = only online sections utilize the OER text. |
||||
| Table 2. Overall Course Grade Outcomes. | |
|---|---|
| Grouping | % ABC grades |
| Control | 63% |
| Mixed exposure | 63% |
| Pure OER | 63% |
| Control | 59% |
| Overall | 61% |
| Table 3. Overall Course Grade Outcomes by Course. | ||
|---|---|---|
| Course | Description | % ABC grades |
| WMST 101 | Intro to Women’s Studies | 65% |
| ESOL 054 | Academic ESOL Reading | 83% |
| FAPA 101 | Intro to Fine & Performing Arts | 80% |
| PSYC 101 | Intro to Psychology | 63% |
| MNGT 140 | Business Law I | 66% |
| CHEM 107 | Fundamentals of Chemistry | 59% |
| MATH 135 | Applied Algebra & Trigonometry | 68% |
| MATH 153 | Intro to Statistical Methods | 55% |
| MATH 163 | College Algebra | 50% |
| Overall | 61% | |
| Table 4. Overall Course Grade Outcomes by Course & OER. | ||||
|---|---|---|---|---|
| Course | Description | % ABC Control | % ABC Mixed | % ABC Pure |
| WMST 101 | Intro to Women’s Studies | 68% | 67% | 58% |
| ESOL 054 | Academic ESOL Reading | 82% | 85% | 82% |
| FAPA 101 | Intro to Fine & Performing Arts | 81% | 88% | 74% |
| PSYC 101 | Intro to Psychology | 68% | 68% | 58% |
| MNGT 140 | Business Law I | 73% | 65% | 63% |
| CHEM 107 | Fundamentals of Chemistry | 61% | 56% | 60% |
| MATH 135 | Applied Algebra & Trigonometry | 71% | 64% | 67% |
| MATH 153 | Intro to Statistical Methods | 56% | 57% | 51% |
| MATH 163 | College Algebra | 50% | 53% | 43% |
| Table 5. Overall Course Grade Outcomes by OER and Pell Status. | |||
|---|---|---|---|
| Pell Status | % ABC Control | % ABC Mixed | % ABC Pure |
| Pell students | 66% | 69% | 71% |
| Table 6. Average Treatment Effects on the Treated (ATTs). | |||||
|---|---|---|---|---|---|
| Variable | ATT | Z value | p | 2.5% | 97.5% |
| OER treatment on course grades | 0.153 | 11.5 | <0.001 | 0.127 | 0.179 |
| OER treatment on pass (ABC grade) rate | 0.0408 | 8.89 | <0.001 | 0.0318 | 0.0498 |
| OER treatment on withdraw rate | -0.0258 | -7.57 | <0.001 | -0.0324 | -0.0191 |
| Table 7. Average Treatment Effects on the Treated (ATTs) Pell Students. | |||||
|---|---|---|---|---|---|
| Variable | ATT | Z value | p | 2.5% | 97.5% |
| OER treatment on course grades | 0.331 | 8.73 | <0.001 | 0.256 | 0.405 |
| OER treatment on pass (ABC grade) rate | 0.0924 | 7.17 | <0.001 | 0.0671 | 0.118 |
| OER treatment on withdraw rate | -0.0478 | -5.27 | <0.001 | -0.0656 | -0.03 |